Amy Gainer
Appendix
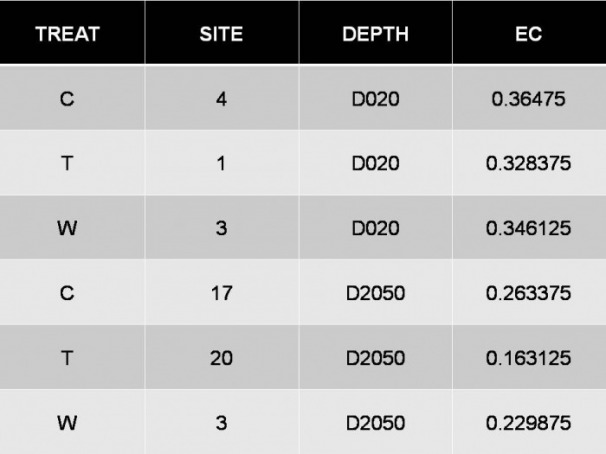
A-1. Fraction of manipulated data table for Ohaton used in boxplots and t test analysis for comparing depths.
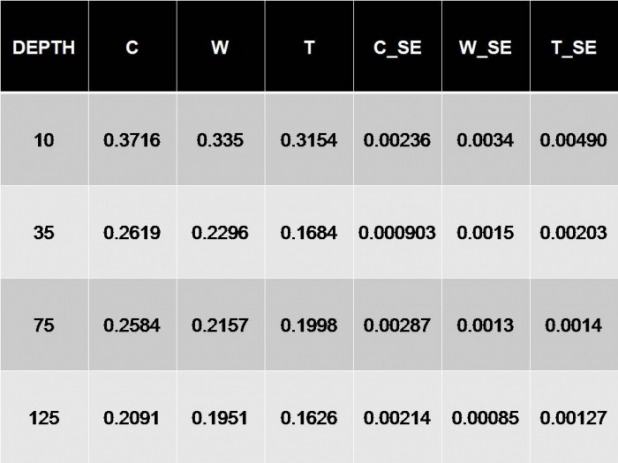
A-2. Fraction of manipulated data table for Ohaton wtih standard error, used to create line plots shown in Results section.
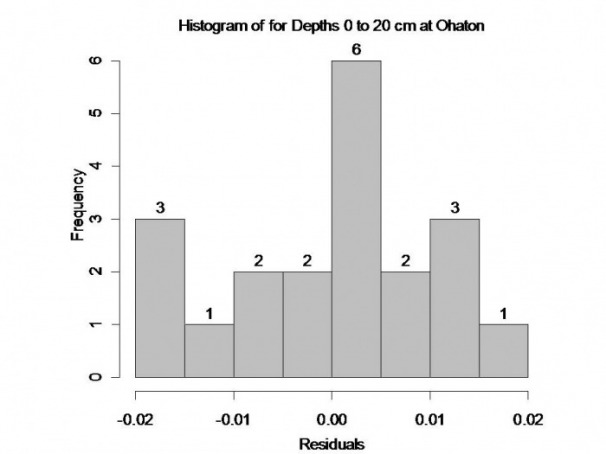
A-3. Histogram of residuals for depth interval 0 to 20 cm at Ohaton showing general shape of data.
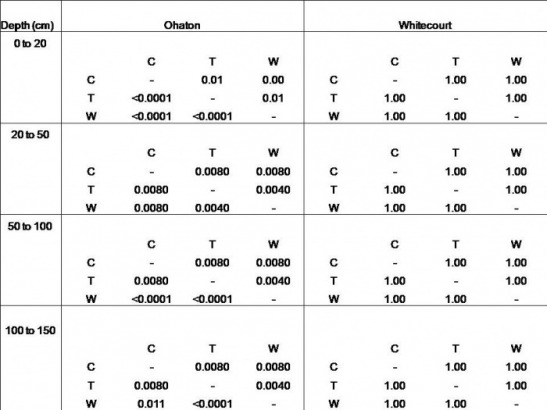
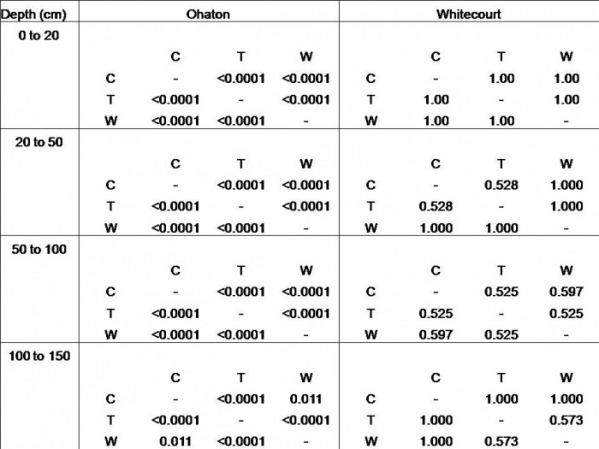
A-4. Matrices of p values from t test comparing treatments performed on all data except between C and T and T and W for Whitecourt, Depth 0 to 20 cm. Matrix is treatment by treatment.
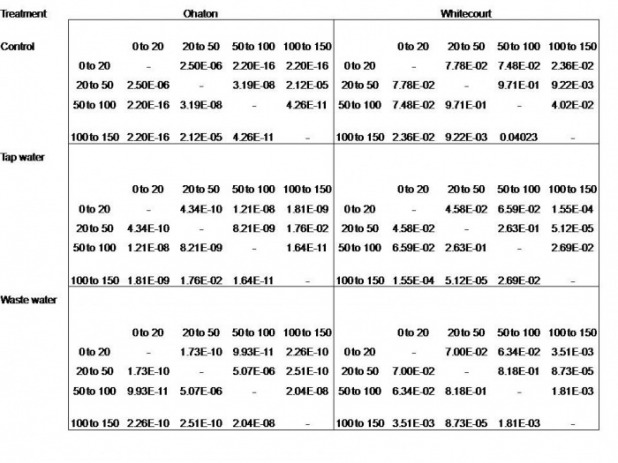
A-5. Matrices of p values from t test for comparing depths for each treatment except tap water at Whitecourt which used a Wilcoxon test. Matrix headings are depth interval by depth interval (cm).
A-6. Matrices of Holm adjusted p values from a Kolmogorov Smirnov test performed to copmare treatment affects at each depth interval.