Amy Gainer
Results and Discussion
1) Treatments
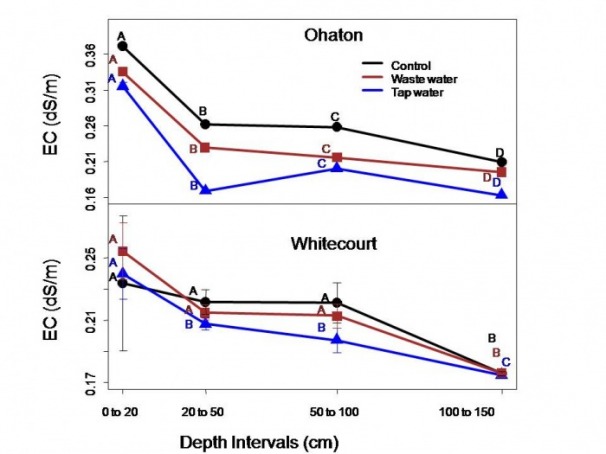
The two sites responded differently to the treatments. At Ohaton, the highest salinity (EC) was found in the control then the wastewater and finally the tap water. All treatments were significantly different. Irrigation with wastewater actually improved the soil quality by decreasing the soil salinity. Tap water further decreased the EC, more than wastewater.
At Whitecourt, there was no response to the treatments. The control, waste water and tap water all had salinity levels that were not significantly different. A possible explanation for this occurrence is that not enough time has elapsed for the salinization process to occur.
From this we can conclude that irrigation with wastewater on naturally saline soil improves its soil quality. This is important because naturally saline soils are not productive agriculturally but using wastewater in irrigation will improve these non agriculturally productive soils. This can be applied to a broader spectrum where wastewater can be used to irrigate various non edible crops.
The results from Whitecourt are informative in that soil salinization does not occur when woody species are irrigated with wastewater. The soil quality can be maintained and the longevity of the project is not limited due to the use of saline irrigation water in the short term. Although the results from Whitecourt show no affect, investigations similar to this one should continue over time to track if the salinization process is occurring in the long run.
R-1. Plot showing difference amoung treatments at various depths for Ohaton and Whitecourt
2) Depths
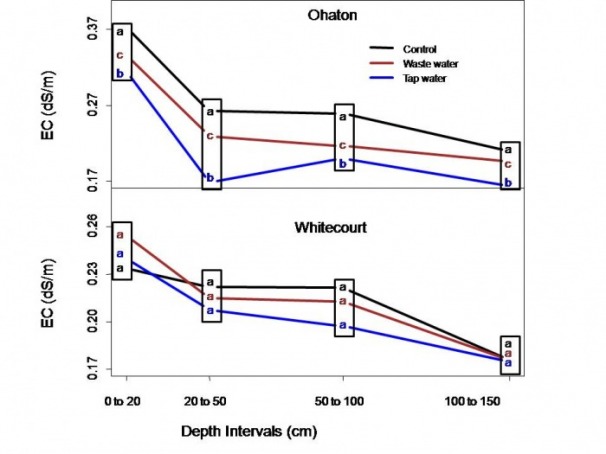
At Ohaton, there is significant differences between the salinity at each depths for a specific treatment. For all treatments, salinity was highest near the ground surface and decreased with depth. This was consistent with the natural occurrence of salts at various depths at the site (with the control). Further experiments on naturally saline soil need to be performed to generalize these results.
At Whitecourt, different patterns arrived. Naturally, the salinity in the top 100 cm is the same but deeper than this the salinity differs and decreases. A similar pattern to the natural conditions occurs when irrigated with waste water. The top 100 cm have significantly higher salinity than less than 100 cm. The general trend for the control and waste water treatments at this particular site is that salinity is relatively constant then drops off at 100 cm depths.
For the tap water treatment we see a slightly different trend. The salinity in the top depth of 0 to 20 cm is significantly different than the intermediate depths of 20 to 50 cm and 50 to 100 cm salinity. The intermediate depths are different than the deepest depth of 100 to 150 cm. The general trend for this treatment at this site is that salinity decreases with depth.
For all treatments at both Whitecourt and Ohaton, the overall trend was that salinity is greatest at the lower depths. This information can be used in further studies for determining the leaching fraction necessary to flush these salts deeper into the subsurface, away from plant roots.
R-2. Plot showing difference between depths for each treatment.