Amy Gainer
Data
Data Collection
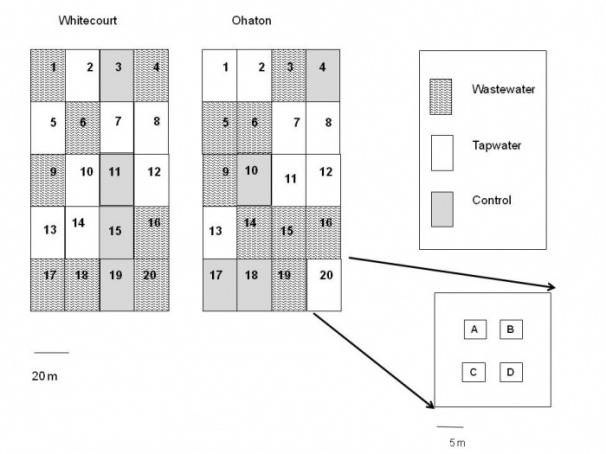
There are two locations for the project, Whitecourt and Ohaton, Alberta. At each site there are two treatment types, wastewater and tap water irrigated. At both locations there are 20 plots, of which 8 are irrigated with wastewater, 8 are irrigated with tap water and 4 control plots (D-1). The plots were randomly assigned treatments. At each plot four locations were measured to get obtain a representative average value (D-1). At each sample unit, an EC probe measured the average EC for the following depth intervals: 0-20 cm, 20 cm-50 cm, 50 cm-100 cm, 100 cm-150 cm. In September 2009, both sites were measured twice, once at the beginning of the month and once at the end. The measurements taken from both times are not independent. Whitecourt and Ohaton are independent of each other so can not be compared.
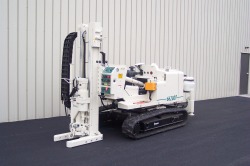
A geoprode drilling rig was used to obtain samples. The EC of the soil was taken to a depth of 150 cm. An EC probe measures electrical conductivity of the soil which is an indicator of the amount of salts in the soil. Salts are charged particles so they transfer the current. A higher EC corresponds with finer textured soils, soils with higher water content and higher salts.
A geoprode drilling rig was used to obtain samples. The EC of the soil was taken to a depth of 150 cm. An EC probe measures electrical conductivity of the soil which is an indicator of the amount of salts in the soil. Salts are charged particles so they transfer the current. A higher EC corresponds with finer textured soils, soils with higher water content and higher salts.
D-1. Layout of treatments at Whitecourt and Ohaton with plot IDs and individual samples locations at each plot.
Data Analysis
The first step of data analysis was to average the A,B,C and D values for each plot location. This gives us a representative value for the plot. Then early values for each plot were averaged with the late values for the plots. D-2 displays the data table resulting from these data analyses. A-1 and A-2 in the Appendix are manipulated tables to aid in graphics such as line plots, one of which contains standard error.
D-2. Simplified Data Table for Whitecourt displaying sampling unit, predictor variable and response variables.
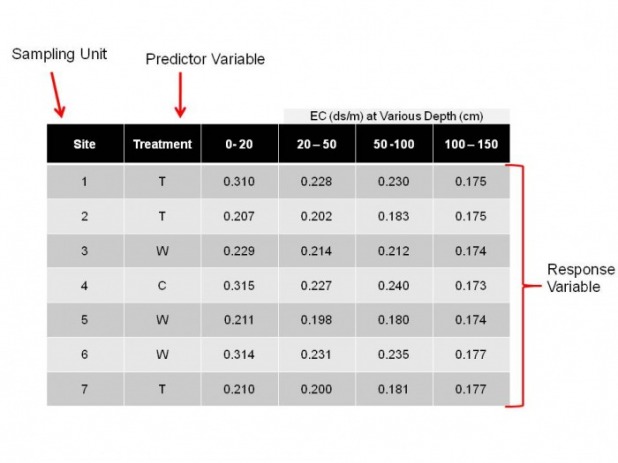
Location and treatment are not manipulated in this project. The predictor variables are categorical, not continuous.
